Debugging a Java application with decompiled source code
When reviewing a local Java-based target for vulnerabilities the first thing I do is decompile the class files into Java with the aid of several decompilers such as CFR, Procyon, etc, then load it into an IDE. I like IntelliJ and other JetBrains products for code review and easy navigation.
Due to the complexity of some codebases, I sometimes have trouble tracing a code flow, or figuring out exactly what data ends up at a sink, just by reading the source code or interacting with the application. This is a perfect case for dynamic analysis.
It is possible to connect an IntelliJ IDEA project containing decompiled source code to the running application and get a pretty good debugging experience. When this works, it is easy to set debug points and see the value of variables, or dump a stack trace to figure out the flow of code.
As an example, here is how to set up a debugger against the Aruba Clearpass “TIPS” application.
First, it is important to get the source lines correct in the decompiled code. Not all Java decompilers stretch lines by default, meaning the line numbers for code in the IDE may not match the lines in the source. This will lead to a poor debugging experience, as the IDE and running application don’t agree on what code is being executed. JD-GUI seems to stretch lines by default, but other decompilers such as CFR and Procyon don’t.
Procyon can be made to stretch lines with the -sl flag:
user@k4:/tmp$ java -jar ~/procyon-decompiler-1.0-SNAPSHOT.jar -sl LoginSubmitAction.class -o out
Decompiling LoginSubmitAction.class...
however, in this case it outputs a comment string that has the side effect of commenting out the package declaration and imports.
user@k4:/tmp$ head -n 3 out/com/avenda/tips/admin/client/web/main/LoginSubmitAction.java
//   // Decompiled by Procyon v1.0-SNAPSHOT  //   package com.avenda.tips.admin.client.web.main;  import com.avenda.tips.rest.entity.CppmSystemEventLoginAuditBean;  import com.avenda.tips.rest.entity.CppmLoginAuditResponse;  import com.avenda.tips.admin.common.NVPair;  import com.avenda.tips.utils.DateUtils;  import java.util.List;  import com.avenda.platform.beans.AppSystemAlert;  import java.util.ArrayList;  import com.avenda.tips.admin.client.web.eventViewer.EventViewerOperations;
import com.avenda.tips.hibernate.beans.configdb.PasswordPolicy;
import com.avenda.tips.admin.client.web.util.TipsMessageHandler;
We need the package line, so the debugger sends the full class name to the debug agent. To remove the comment, use the undocumented flag --suppress-banner.
user@k4:/tmp$ java -jar ~/procyon-decompiler-1.0-SNAPSHOT.jar --suppress-banner -sl LoginSubmitAction.class -o out
Decompiling LoginSubmitAction.class...

user@k4:/tmp$ head -n 3 out/com/avenda/tips/admin/client/web/main/LoginSubmitAction.java
package com.avenda.tips.admin.client.web.main;  import com.avenda.tips.rest.entity.CppmSystemEventLoginAuditBean;  import com.avenda.tips.rest.entity.CppmLoginAuditResponse;  import com.avenda.tips.admin.common.NVPair;  import com.avenda.tips.utils.DateUtils;  import java.util.List;  import com.avenda.platform.beans.AppSystemAlert;  import java.util.ArrayList;  import com.avenda.tips.admin.client.web.eventViewer.EventViewerOperations;
import com.avenda.tips.hibernate.beans.configdb.PasswordPolicy;
import com.avenda.tips.admin.client.web.util.TipsMessageHandler;
Import this code with stretched lines into an IntelliJ project. As code without “stretched lines” is often easier to read I usually create two projects, one for debugging with correct line numbers, and the other for reading.
Adding debug server
In a shell on the target, run ps -ef and look for java. We can see a couple of Java processes, that look like they correspond to “frontend” and “backend” deployments of tomcat.
# ps -ef | grep java
avendat+  8858     1  1 04:00 ?        00:02:23 /usr/lib/jvm/jre/bin/java -Djava.util.logging.config.file=/var/avenda/tomcat/frontend/conf/logging.properties -Djava.util.logging.manager=org.apache.juli.ClassLoaderLogManager -Djdk.tls.ephemeralDHKeySize=2048 -Djava.protocol.handler.pkgs=org.apache.catalina.webresources -Dorg.apache.catalina.security.SecurityListener.UMASK=0022 -Dtomcat.instance.name=frontend-tomcat -server -Xmx1950m -XX:MaxMetaspaceSize=300m -XX:+HeapDumpOnOutOfMemoryError -XX:HeapDumpPath=/var/avenda/tips/log/tips-admin/ -XX:OnOutOfMemoryError=/usr/local/avenda/tips/bin/tipsAdmin/restartFrontendTomcat.sh -Dorg.owasp.esapi.resources=/var/avenda/tomcat/frontend/webapps/tips/WEB-INF/classes -Djava.net.preferIPv6Addresses=false -Dignore.endorsed.dirs= -classpath /usr/local/avenda/third-party/tomcat/bin/bootstrap.jar:/usr/local/avenda/third-party/tomcat/bin/tomcat-juli.jar -Dcatalina.base=/var/avenda/tomcat/frontend -Dcatalina.home=/usr/local/avenda/third-party/tomcat -Djava.io.tmpdir=/var/avenda/tomcat/frontend/temp org.apache.catalina.startup.Bootstrap start
avendat+ 44000     1  0 Jan21 ?        00:03:57 /usr/lib/jvm/jre/bin/java -Djava.util.logging.config.file=/var/avenda/tomcat/backend/conf/logging.properties -Djava.util.logging.manager=org.apache.juli.ClassLoaderLogManager -Djdk.tls.ephemeralDHKeySize=2048 -Djava.protocol.handler.pkgs=org.apache.catalina.webresources -Dorg.apache.catalina.security.SecurityListener.UMASK=0022 -Dtomcat.instance.name=backend-tomcat -server -Xmx1560m -XX:MaxMetaspaceSize=256m -XX:+HeapDumpOnOutOfMemoryError -XX:HeapDumpPath=/var/avenda/tips/log/tips-network-services/ -XX:OnOutOfMemoryError=/usr/local/avenda/tips/bin/restartBackendTomcat.sh -Djava.net.preferIPv6Addresses=false -Dignore.endorsed.dirs= -classpath /usr/local/avenda/third-party/tomcat/bin/bootstrap.jar:/usr/local/avenda/third-party/tomcat/bin/tomcat-juli.jar -Dcatalina.base=/var/avenda/tomcat/backend -Dcatalina.home=/usr/local/avenda/third-party/tomcat -Djava.io.tmpdir=/var/avenda/tomcat/backend/temp org.apache.catalina.startup.Bootstrap start
Of note is the third column, which corresponds to the parent ID of the process. This is 1, which indicates either PID 1 started it, which in this case is systemd, or the parent has died and it has been “re-parented” to PID 1. It’s a reasonable assumption that a service starts Tomcat, so we can use a nice systemd feature systemctl status <PID> to see which service is associated with the process.
# systemctl status 8858
● frontend-tomcat.service - Frontend Tomcat
   Loaded: loaded (/usr/lib/systemd/system/frontend-tomcat.service; enabled; vendor preset: disabled)
   Active: active (running) since Fri 2022-01-21 10:24:14 NZDT; 20h ago
  Process: 7656 ExecStop=/usr/local/avenda/third-party/tomcat/bin/shutdown.sh (code=exited, status=0/SUCCESS)
  Process: 7702 ExecStart=/usr/local/avenda/third-party/tomcat/bin/startup.sh (code=exited, status=0/SUCCESS)
  Process: 7696 ExecStartPre=/usr/local/avenda/common/bin/frontend-tomcat-pre-exec.sh (code=exited, status=0/SUCCESS)
 Main PID: 8858 (java)
The ExecStartPre attribute refers to a script frontend-tomcat-pre-exec.sh that looks for scripts in an “app-scripts” folder, and sources them. In the app-scripts folder there is a script frontend-tomcat-env.sh that looks promising. This exports several JVM options, then adds them to a variable CATALINA_OPTS that is used by Tomcat.
Debugging JVMs is done by adding the following to the JVM args: -agentlib:jdwp=transport=dt_socket,server=y,suspend=n,address=8000
We want to make sure suspend is set to n, so it doesn’t interrupt the server starting (unless there’s something in the startup you want to debug).
If you are using JVM 9 or later, the address parameter restricts connections to localhost by default. For remote connections, specify address=*:8000 to listen on all interfaces. Clearpass uses JVM 8, so we can omit the *.
I created a new “DEBUG_OPTS” variable and added it to the CATALINA_OPTS variable.
export DEBUG_OPTS="-agentlib:jdwp=transport=dt_socket,server=y,suspend=n,address=8000"
export CATALINA_OPTS="$CATALINA_OPTS -server -Xmx""$ACTUAL_MEMORY""m -XX:MaxMetaspaceSize=300m $HEAP_DUMP_OPTS $JCONSOLE_OPTS $FT_APPS_OPTS $NET_OPTS $DEBUG_OPTS"
After restarting the frontend-tomcat.service it is listening on port 8000.
# netstat -plantu | grep 8000
tcp        0      0 0.0.0.0:8000            0.0.0.0:*               LISTEN      8858/java
The appliance firewalls port 8000, so we add an iptables rule to allow external access:
# iptables -A INPUT -p tcp --dport 8000 -j ACCEPT
Ensure you do not expose this port to untrusted networks, as JDWP can be used to gain RCE.
Debug client config
Now the debugger is listening on the target, we need to configure it in IntelliJ. In the project with the line-stretched source code, create a Run/Debug configuration under Run->Edit Configurations, like the following:
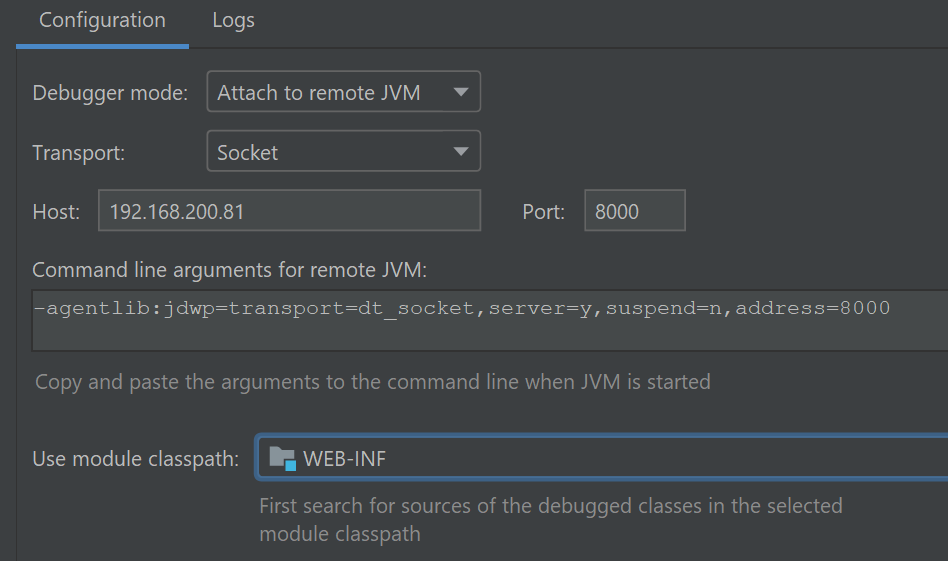
Then select Run->Debug, and the created configuration. A window should open, and output Connected to the target VM, address: '192.168.200.81:8000', transport: 'socket'
Let’s say we want to debug the login action, decompiled above.
Set a breakpoint on the doValidate method in the class, which is called during login. There should be a small tick on the breakpoint dot. If not, it’s likely that the line numbering is incorrect, or the wrong class and method name to break is being sent to the debugger stub.
Issue a login request, and the debugger should break:
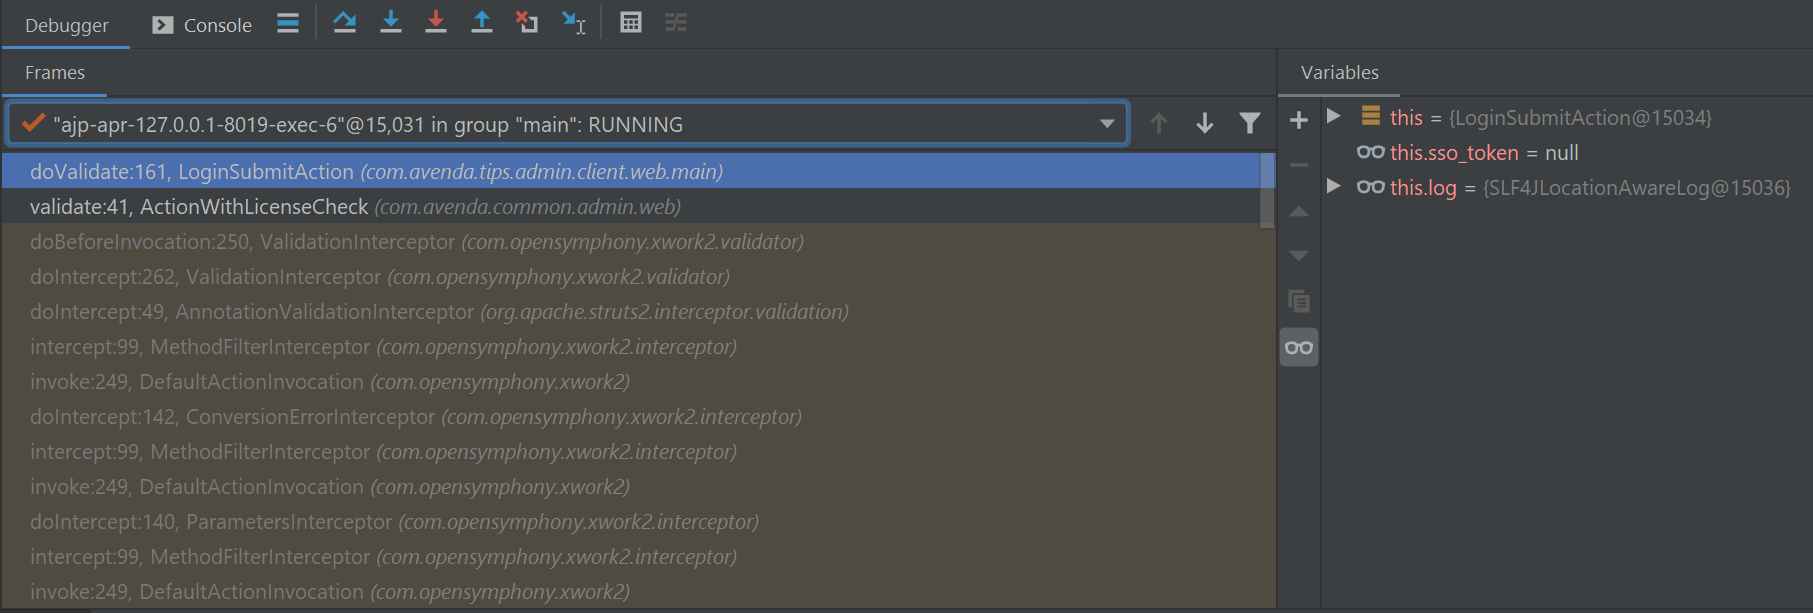
It is now possible to step through the execution, inspecting variables and the call stack.
For example, after stepping through a few lines the submitted username and password are visible as variables:
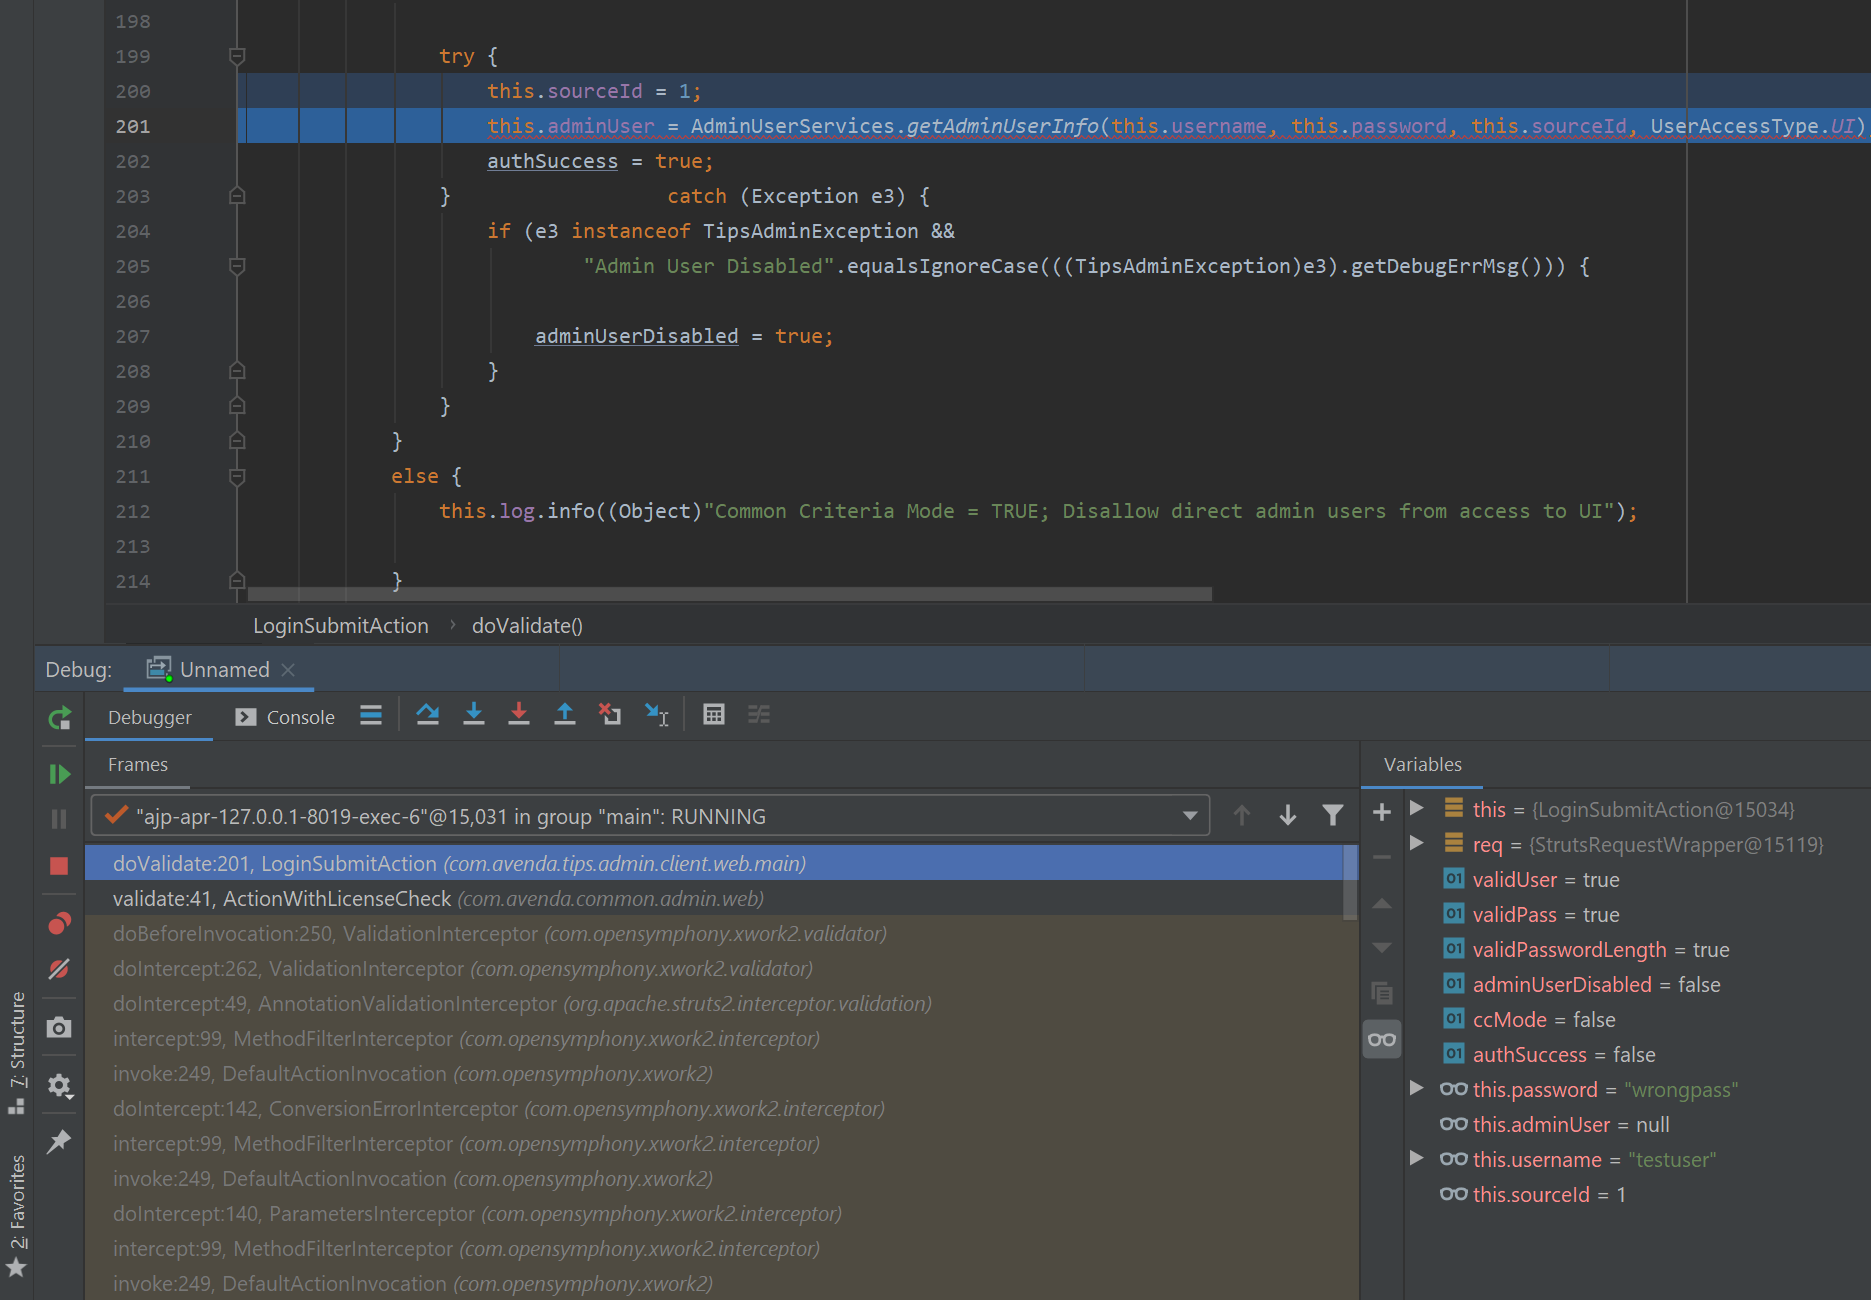
Now it is possible to investigate the value of variables, and determine the call stack where it is unclear from source code alone.
Another good idea is setting breakpoints on dangerous functions in the codebase. For example, setting a breakpoint on the ProcessBuilder constructor can catch when it is used by the application:

However, this can interfere with the application if it frequently uses the breakpointed function, and you need to go back to IntelliJ to continue execution every time. IntelliJ can alter the breakpoint so that it does not suspend execution, and instead evaluates an expression:
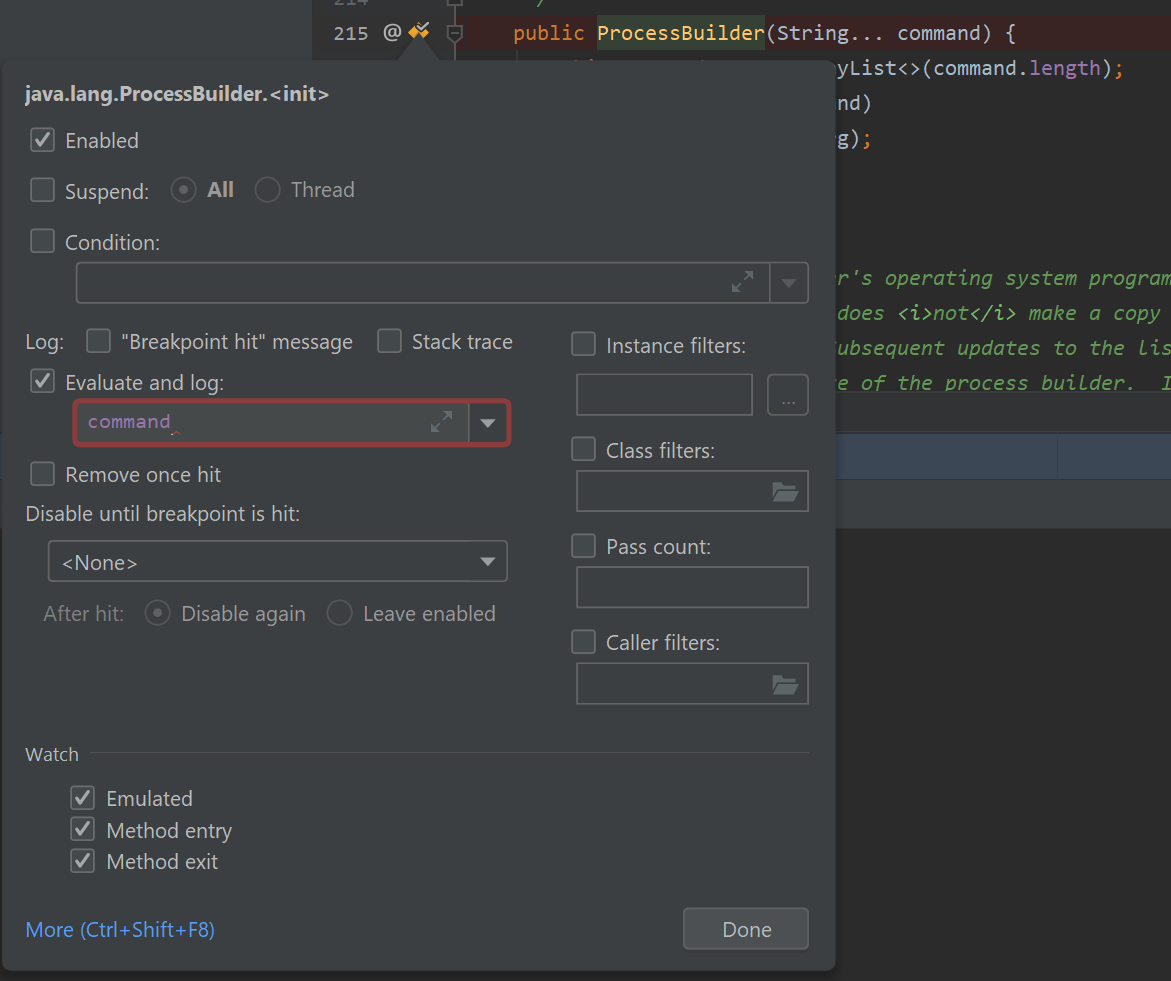
Once this change is made the application will continue to run, with the debugger printing out the value of the command string array whenever the ProcessBuilder constructor is called:
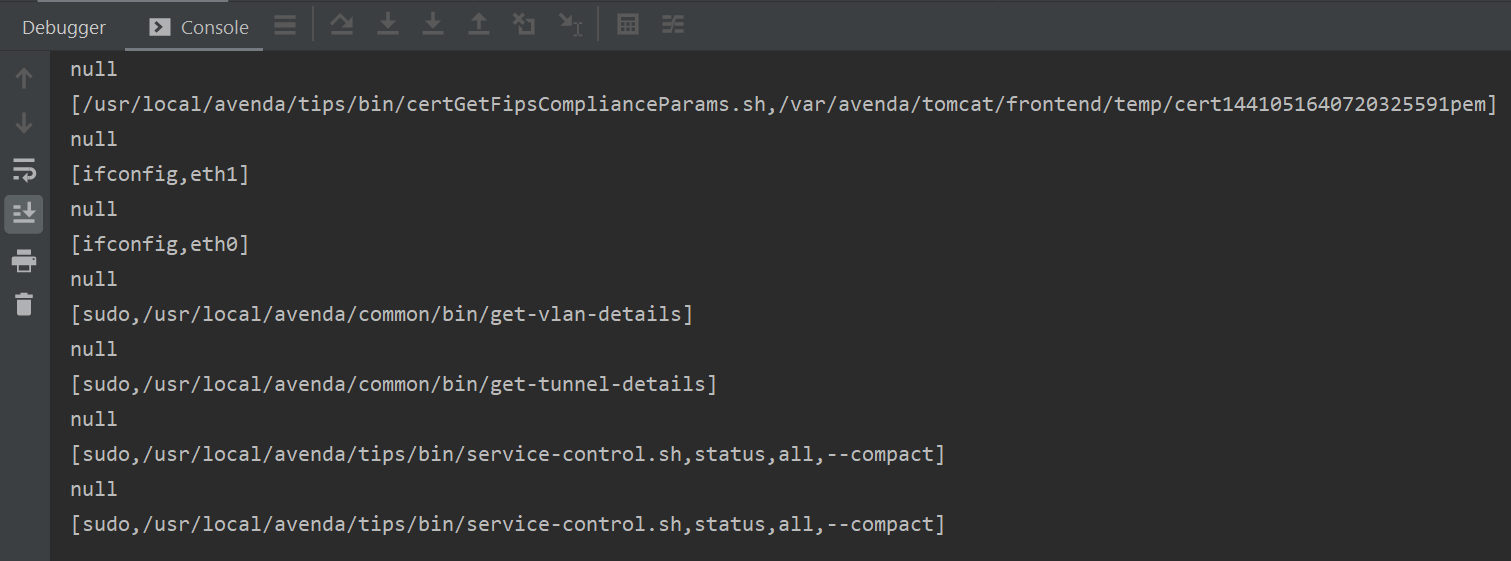
This is useful for tracking calls to dangerous sinks at application runtime, rather than through static analysis of the code. Now we can use this to debug applications and track down more complex vulnerabilities!